Total Cost of Ownership
Total cost of ownership (TCO) requires a purchaser to identify and measure costs beyond the standard unit price, transportation, and tooling when evaluating purchase proposals or supplier performance. Formally, total cost of ownership is defined as the pres- ent value of all costs associated with a product, service, or capital equipment that are incurred over its expected life.
Most large firms base purchase decisions and evaluate suppliers on cost elements beyond unit price, transportation, and tooling. Research indicates, however, that companies differ widely about what cost components to include in a total cost analysis.
Typically these costs can be broken into four broad categories:
• Purchase price. The amount paid to the supplier for the product, service, or capital equipment.
• Acquisition costs. All costs associated with bringing the product, service, or capital equipment to the customer’s location. Examples of acquisition costs are sourcing, administration, freight, and taxes.
• Usage costs. In the case of a product, all costs associated with converting the purchased part/material into the finished product and supporting it through its usable life. In the case of a service, all costs associated with the performance of the service that are not included in the purchase price. In the case of capital equipment, all costs associated with operating the equipment through its life. Examples of usage costs are inventory, conversion, scrap, warranty, installation, training, downtime, and opportunity costs.
• End-of-life costs. All costs incurred when a product, service, or capital equipment reaches the end of its usable life, net of amounts received from the sale of remaining product or the equipment (salvage value) as the case may be. Examples of end-of-life costs are obsolescence, disposal, clean-up, and project termination costs.
Building a Total Cost of Ownership Model
Building a TCO model is not an easy task. It requires input from different parts of the organization and a thorough understanding of the process through the entire life cycle. The following steps must be taken to ensure that all costs are captured correctly:
Step 1. Map the process and develop TCO categories. Construct a process map from the time a need for the product, service, or capital equipment is identified all the way through the life cycle. The activities that you identify will help to develop broad TCO categories.
Step 2. Determine cost elements for each category. Using the process map as a guide, identify the subcost elements that make up each TCO category.
Step 3. Determine how each cost element is to be measured. This is a critical step. The metrics must be determined to quantify each of the cost elements identified in Step 2. For example, to quantify the costs of sourcing labor, the hourly rate of the individuals performing the sourcing activity and the amount of time they spend or will spend doing it will need to be known.
Step 4. Gather data and quantify costs. This is the most difficult and time- consuming step. In this step, gather data for each of the metrics identified in Step 3 and quantify the respective costs. This requires information from various sources including interviews, surveys, the A/P system, and other internal databases. If information from internal data- bases is used, make sure to validate the numbers. Input errors can sometimes cause the numbers generated by these databases to be significantly inaccurate.
Step 5. Develop a cost timeline. Construct a cost timeline for the length of the life cycle. Place each cost element quantified in Step 4 in the appropriate time period. Then calculate totals for each time period as shown in the example.
Step 6. Bring costs to present value. Computing the present value allows decisions to be made based on present dollars. This is important because a dollar spent one year from now is not worth the same as a dollar spent now. The value of money spent any time in the future will depend on the organization’s cost of capital. To calculate the present value, therefore, obtain the organization’s cost of capital from its finance department. Then calculate the present value of each total in the cost timeline by using a present value table or a financial calculator. The sum of present values for each time period re- presents the total cost of ownership.
The Importance of Opportunity Costs
When considering usage costs, make sure to identify opportunity costs, if any. An opportunity cost is defined as the cost of the next best alternative. Typical opportunity costs include lost sales, lost productivity, and downtime. The absence of these costs in an analysis could lead to an entirely different decision and, possibly, a wrong one, as illustrated below.
A supply manager looking to purchase a machine was evaluating two alternatives. Alternative A was priced at $100,000, and B was priced at $125,000. The delivery lead time for Machine A was 90 days, and Machine B was 30 days. When determining usage costs for A it was important to add the lost revenue that would have been generated during the 60 days (90 − 30 = 60) had machine B been installed. By including the cost of lost revenue, B became the better alternative even though it was priced higher.
In another case, a supply manager made the decision, based primarily on price, to purchase Machine Y instead of Machine X. His analysis, however, omitted the opportunity cost from the difference in production capacity between the two machines. Machine X was capable of producing 10 percent more units than Machine Y. In a market upswing, sales potential increased by 10 percent. Machine Y was unable to handle the increase, and a new machine had to be purchased. Had the supply manager selected Machine X, the purchase of a new machine could have been deferred, thereby saving hundreds of thousands of dollars. Mistakes like this can easily be avoided by ensuring that all costs, especially opportunity costs, are captured in the TCO.
Sourcing Snapshot Xerox Product Cost Management
Xerox has two product areas: production systems and office machines. Production systems are the products manufactured for companies that generate revenue with Xerox’s large systems. Ex- amples include print shops, insurance companies, and banks that run millions of print docu- ments every month. In this environment, the goal is to deliver business solutions for a total cost decision, where the price of the unit is not an important parameter, but rather the solution that delivers more print per hour is more competitive, and the service package wrapped around that solution. The profit drivers in this case are in the consumables down the road, and the reli- ability of the machine is the number one cost driver. Costs will not be traded off for reliability in any new product design.
Office machines are all the multi-functional copiers, printers, and devices utilized in office envir- onments. In this business, lowest price possible is the singular parameter driving customer sales. However, cost competitiveness is critical to drive down selling price, and profit is made from the consumables and service that is provided to the business.
At Xerox, cost management is acknowledge to be the #1 driver for all new product introduction ac- tivity, as well as the #1 driver for business plans and all sourcing activities around target cost. Xerox has established their own internal systems group, called product cost engineering that con- ducts competitive teardowns, cost analysis, and best of breed modeling on an ongoing basis. The team regularly meets to identify the best elements from new competing products to derive a best of breed product and a target price to work towards. Working in parallel with the business teams, they will then work to develop a cost target based on the business’s model and marketing plan.
These two elements—the business plan and the cost targetcombined with best of breed pricing, forms the underlying basis for all worldwide sourcing activity.
There is an understanding that not all target prices will be hit, although Xerox will be very close on some. A best of breed profile is provided, whereby directives such as “you will find stampings in the Czech republic, and assembly in Mexico,” and so forth are found. However, this provides a mecha- nism for negotiating terms other than bottom line price. The PC (Product Cost) group provides a full cost breakdown, with labor estimation, profit, and overhead estimation, with the objective of getting key suppliers to share that same data. If a cost estimate is off, based on APO (Accounts Payable Organization) data validation, it can be a PC education. There are many different negotiations and cost elements that go into each one.
To support PC, investments in software were made early on. This is a proprietary application developed at Xerox that allows PC’s to conduct their analysis. This is well-established on the direct side, but there is an opportunity to better utilize this capability on the indirect side. A PC can tell you how much a pound of resin should cost, but is not able to break down the cost drivers for toner. This was a labor intensive process on the front end to collect the data. However, the system now allows product cost engineers to input design concept data, go through a series of process steps, pick and choose options, which drives specific data such as sheet metal parts, the machine hours for that region, and the labor hours. The PC essentially identifies the part, inputs the process, and identifies the correct parameters to build up the cost model.
Advanced Manufacturing Engineers (AMEs) with expertise in processes are employed in the early stages of product concept design, and suppliers are invited to send major representa- tives to work with the design group. At these meetings, the team reviews individual parts, look for design changes that can be made for ease of manufacture, and focus primarily on the high cost complex parts, using Design for Six Sigma approaches. The AMEs have a strong background in plastics, sheet metal, electronics, and the like, and understand best practices in the technology, which helps them to work with the design community and guide them in the right decision.
Xerox utilized a contract manufacturer (CM), and this relationship is driven around a total landed cost model. The CM does almost the entire printer manufacturing for the office market, and will ship the completed printer to Xerox. Their logistics group is also involved in supply chain model- ing to enable amortization of shipping costs, understand where parts are coming from, going to, and what the resulting chain will look like when the design is executed. This may further drive moving business to different suppliers when transportation costs drive this decision.
Source: Handfield, R., and Edwards, S. (2009, July), “Cost Leadership Best Practices,” White Paper, Supply Chain Resource Cooperative, NC State University
Important Factors to Consider When Building a TCO Model
• Building a TCO can be a costly and time-intensive activity. Use it for evaluating larger purchases.
• Make sure to obtain senior management buy-in before embarking on a fullfledged TCO. It will make data gathering much easier, especially if several people from different parts of the organization have to be interviewed.
• Work in a team. This will greatly reduce the time required for data collection activities, which can be distributed among team members.
• Focus on the big costs first. Spending extended periods of time quantifying small cost elements will only delay the decision, which in most cases will not be impacted by them.
• Make sure to obtain a realistic estimate of the life cycle. A life cycle that is too short or too long could result in a wrong decision.
• Whether evaluating a purchase option or making an outsourcing decision, a TCO model will ensure that the right decision is made, at least from a cost perspective.
• When considering global sourcing, consider all of the relevant labor, quality, logistics, and import costs associated with the total supply chain.
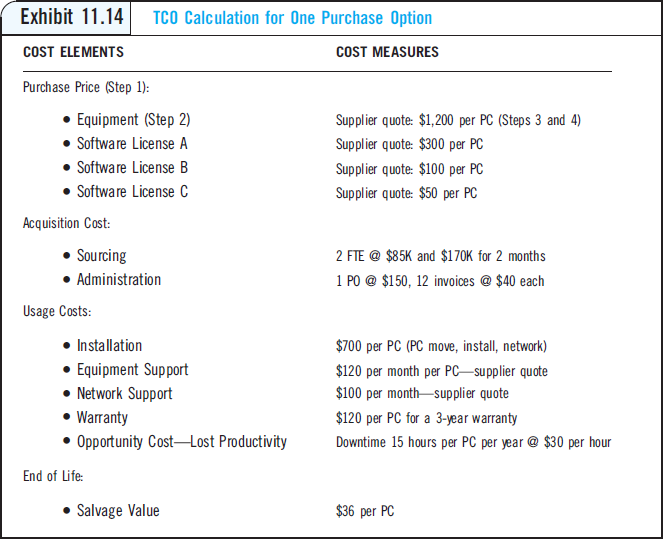
Example of a TCO Model Supply manager Joe Smith was considering the purchase of 1,000 desktop PCs for his organization. The life cycle was three years, and the organization’s cost of capital was 12 percent. He calculated the TCO for one of the purchase options as shown in Exhibit 11.14.
Using these elements, the total cost of ownership for each of these decisions was calculated as shown in Exhibit 11.15.
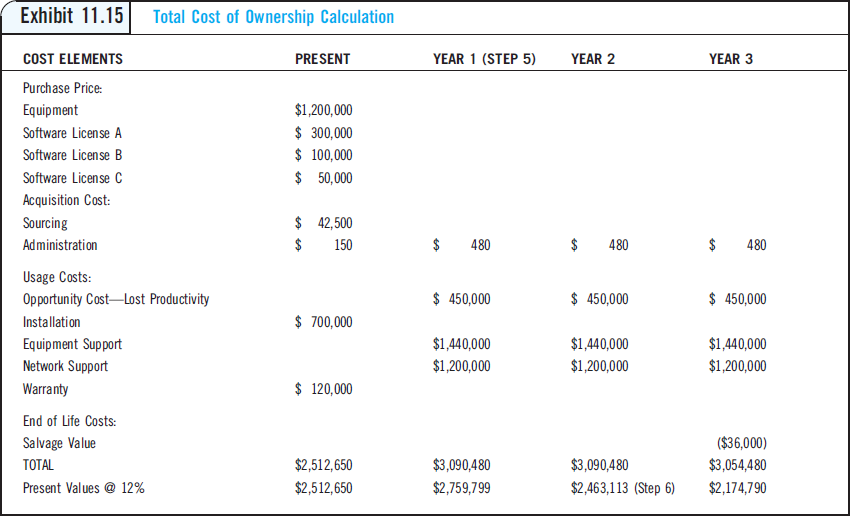
On the basis of this model, the supply manager should explore the possibilities of reducing service costs such as equipment support and network support—these appear to be the highest value, and contribute most to costs. This is also typically the most profitable area for the supplier, as services are often not audited.