Price Analysis
In order to understand the factors affecting pricing levels in a given market, it is cru- cial to employ a market analysis—an analytical tool that identifies the primary external forces that are causing prices to either increase or decrease. As shown in Exhibit 11.5, prices are driven to a large extent by the degree of competition in a market, as well as by conditions of supply and demand. The resulting market prices are indicated by a heavier line, depending on the volume of supply in a given situation.
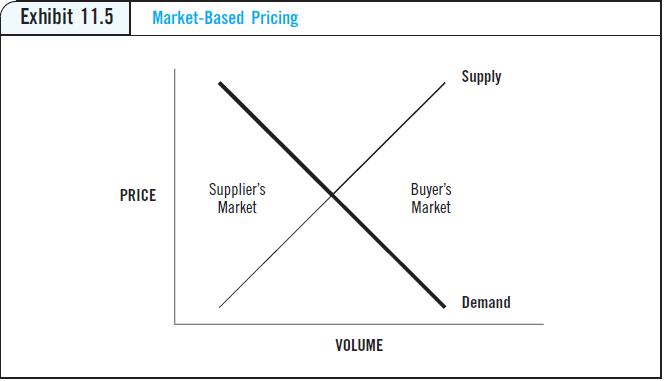
When demand exceeds supply, a seller’s market exists, and prices generally increase. The reverse situation, a buyer’s market, occurs when supply exceeds demand, and prices generally move downward. There should be an appreciation for the variety of variables that directly and indirectly influence an item’s price.
Market Structure
Although it is clear that the supplier’s market condition has a major influence on price, the factors affecting market conditions are not always easy to predict. Market en- vironment is often driven by the number of competitors in an industry, the relative sim- ilarity (or lack thereof) of their products, and any existing barriers to entry for new competitors. At one end of the scale, there may exist a monopoly, where only one sup- plier can provide a given product or service. A good example of this condition exists in the pharmaceutical industry, where the company first to market with a new patented drug has exclusive rights to sell the product for seven years. (At the end of this period, generics that copy the drug’s formulation enter the market, thereby driving down the cost of the drug.) At the other end of the spectrum is perfect competition, in which there exist identical products with minimal barriers for new suppliers to enter the market. Price is solely a function of the forces of supply and demand. No single seller or producer controls enough of the market to affect the market price. Of course, a seller could reduce its price with the hope of selling additional products. In the long run, however, this simply results in lost revenue.
An industry with only a few large competitors is classified as oligopolistic. The market and pricing strategies of one competitor directly influence others within the industry. Examples of oligopolies in the United States historically include the steel, automobile, and appliance industries. Within an oligopolistic industry, a firm may assume the role of a price leader and raise or lower prices, which can result in all other firms changing their prices or choosing to maintain existing price levels. If others do not follow, the initiating firm might be forced to reverse the change. The growth of international trade and competition has created additional choices in many industries, shifting market power away from the producer and toward the purchaser.
Economic Conditions Economic conditions often determine whether a market is favorable to the seller or to the purchaser. When capacity utilization at producers is high (supply is tight) and de- mand for output is strong, supply and demand factors combine to create pricing condi- tions favorable to the seller. When this occurs, buyers often attempt to keep prices or price increases below the industry average. When an industry is in a decline, purchasers can take advantage of this to negotiate favorable supply arrangements.
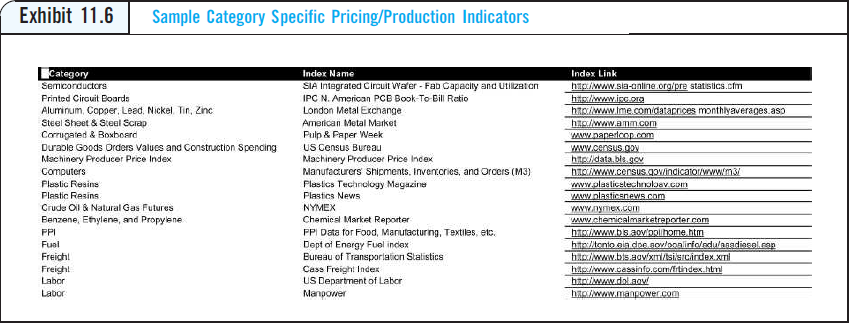
The macroeconomy influences prices; for example, interest rate levels influence the internal rate of return at a supplier—the overall cost of capital, which drives productive investment. Even the level of the dollar in relation to other currencies influences price, particularly for international supply management. Also, tight labor markets can create cost increases, resulting in higher purchase prices. Knowledge of economic conditions is helpful when identifying the market factors af- fecting the supply and demand for a product or commodity. Awareness of current and forecasted economic conditions assists in the development of purchase budgets and ma- terial forecasts, and also provides valuable insights when developing future price negoti- ating strategies. One good source of information is the website for the Institute for Supply Management, www.ism.ws, which presents key data on pricing trends for a vari- ety of commodities. Other sources of pricing trends in commodity markets are shown in Exhibit 11.6 below.
Pricing Strategy of the Seller
Sellers pursue different strategies or approaches that affect the pricing of their pro- ducts or services. Some sellers rely on a detailed analysis of internal cost structures to establish price, whereas others simply price at a level comparable to the competition.
The pricing strategy of the seller has a direct impact on quoted prices. In order to remain in business, suppliers must cover their costs and earn an overall profit in order to meet their corporate objectives. In many cases, however, the price charged by a seller may have little or no relationship to actual costs. As strange as this seems, pricing strat- egies are often based on other factors that are important to the seller. A seller may quote an unusually low price to secure a purchase contract, with the intention of raising the price once it drives competition from the marketplace. In other cases, the seller may exploit its position when it senses it has the purchaser over a barrel by charging an excessive price. In still other cases, the seller may simply not understand its own costs. Several questions should be asked when analyzing a seller’s pricing strategy. These include the following:
• Does the seller have a long-term pricing strategy, or is it short-term in nature?
• Is the seller a price leader (sets new pricing levels in the market), or a price follower (only matches price increases/decreases when the competition does so)?
• Is the seller attempting to establish entry barriers to other competitors by establishing a low price initially, then preparing to raise prices in the future?
• Is the seller using a cost-based pricing approach, which develops price as a function of true costs, or a market-based pricing approach? If a market-based pricing approach is being used, there may be little need for conducting a detailed cost analysis, as the price charged may be unrelated to any elements of cost.
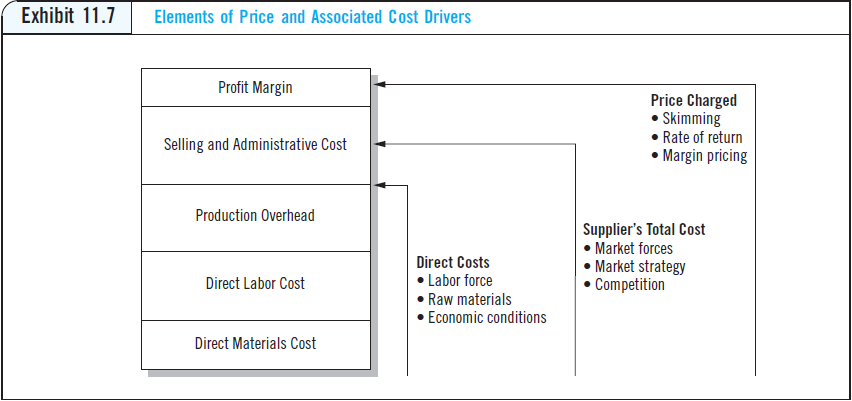
The elements that make up the price charged by a supplier are shown in Exhibit 11.7. Essentially, the supplier’s costs include materials and labor (which together make up manufacturing cost), plus overhead and sales, general and adminis- trative expenses (which cumulatively establish the supplier’s total cost), plus margin, which then equates to the price charged. Based on the interplay among these different elements, which may vary depending on the supplier’s pricing model, the price charged to a buyer can vary significantly. Seller pricing strategies can be grouped into two categories: market-driven models and cost-based models. As we noted earlier, price analysis involves having the supply manager gauge the pricing strategy used by the supplier, without going into the details of how its detailed cost elements are estab- lished. We will cover market-driven pricing models first, then cover cost analysis tech- niques later in the chapter.
Market-Driven Pricing Models2
Price Volume Model
In the price volume model, the supplier analyzes the market to find the combination of price per unit and quantity of sales that maximizes its profit on the assumption that (1) lowering the price will result in more units being sold, and (2) greater volume will spread the indirect cost over more units, therefore maintaining or even increasing the profit as it relates to the price. The most basic example of this model is the supplier’s offering quantity price breaks to induce the buyer to purchase in larger quantities (a core approach adopted by Sam’s Club and Costco stores). Strategic sourcing initiatives should always engage a thorough analysis of the relationship between price and quantity in different marketplaces. Combining purchase requirements across separate operating units can yield savings in tooling, setup, and operating efficiencies. A major benefit of reduced or single sourcing is a lower price that results from the higher volumes offered to a supplier. In return for a purchase contract with higher volumes, a buyer expects favorable pricing because a sup- plier should realize lower per-unit costs. The willingness of a supplier to offer quantity discounts also affects the final selling price. Although a quantity discount has a positive effect on the purchase price, a pur- chaser must be cautious about the net impact on the total cost of the item. Buying in larger-than-normal quantities requires additional storage of purchased goods. At a time when most firms are reducing or even eliminating inventory, the additional inventory-carrying costs must be evaluated against the benefit of the quantity discount.
Market-Share Model
In the market-share model, pricing is based on the assumption that long-run profit- ability depends on the market share obtained by the supplier. This approach, also referred to as “penetration pricing,” is an aggressive pricing approach for efficient pro- ducers because price is a direct function of cost. Penetration pricing can lead to faster market penetration for a product because of the lower profit margins a seller is willing to accept. Generally speaking, the seller is willing to take a lower price because of the potential mass market appeal of the product, resulting in substantially higher sales volumes. In the initial stages of this model, the supplier may even accept losses, but as its volume increases, the cost per unit decreases and long-term profits are achieved. A word of caution is in order here: Purchasers should question whether the seller is the most efficient producer willing to accept lower margins to win market share, or is the real intention to drive competition from the marketplace and later raise prices to exorbitant levels?
Sourcing Snapshot When Should Companies Use Price Hedging
The last few years have witnessed a remarkable volatility in prices. The following snapshot writ- ten by Robert Rudzki provides some insights into how supply managers can manage price risks, and avoid getting into trouble.
Rudzki provides insights into what he calls “financial risk management” or—as it is more gen- erally termed—“hedging.” A common way for companies to begin to focus on the subject of commodity price risk—and to gain an unpleasant first experience—is to experience a massive runup in commodity prices. This event typically results in two unpleasant outcomes. The first is that it creates an unfavorable financial variance to a business plan that attracts top manage- ment’s attention.
The second unpleasant experience results from the reaction to the first: it often spurs those com- panies to begin hedging right away, often at (in hindsight) what turns out to be the peak of commodity prices. Inevitably, in a short period of time they see their hedging programs begin to report unfavorable variances to market prices as commodity prices retreat away from their recent peaks. At that point, if it has not occurred sooner, the finger-pointing begins.
Successful risk management starts with proactively identifying and managing risks with a focus on minimizing the potential financial impact on the corporation. For each corporation, there is some level of risk which that corporation is willing and capable of assuming (some- times referred to as the corporate risk retention level). The capability of the corporation to assume risk is heavily influenced by its capital structure, liquidity, and business outlook. An investment grade company that has strong earnings and cash flow can retain much more risk than a below-investment grade company having poor liquidity and marginal earnings performance.
Companies that jump to a narrow implementation of hedging tools, without the benefit of strate- gically considering their earnings at risk “Value at Risk (VAR)” may face challenges in the future. Unexpected events and disappointing results may follow.
Let us assume that the high-level thought process described in the prior paragraph has occurred. It is probably appropriate for every corporation, regardless of financial condition, to do certain amounts and types of financial risk management to reduce risks and to add value. Hedging re- presents a way to reduce risk as well as to add value. Hedging should play a prominent role in financial risk management, especially in the areas of interest rate exposures, commodity price exposures, and foreign currency exposures.
Hedging is a strategy used to offset (and thereby reduce) risk, generally accomplished with op- tions (caps), swaps, or costless collars. The principal attributes of these hedging tools appear in the figure below. A perfect hedge is one that eliminates the possibility of future (additional) gain or loss by exactly offsetting the exposure being hedged. Most hedges are imperfect to varying degrees.
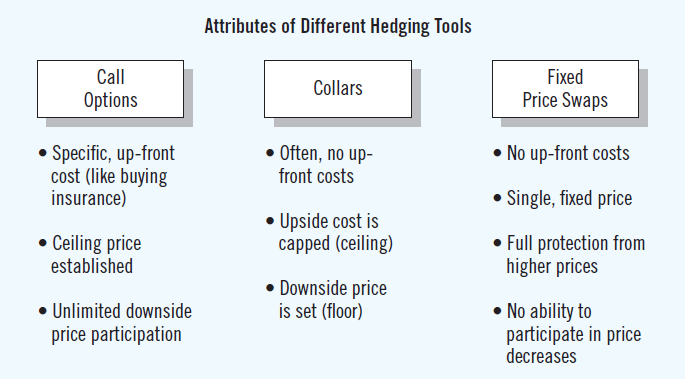
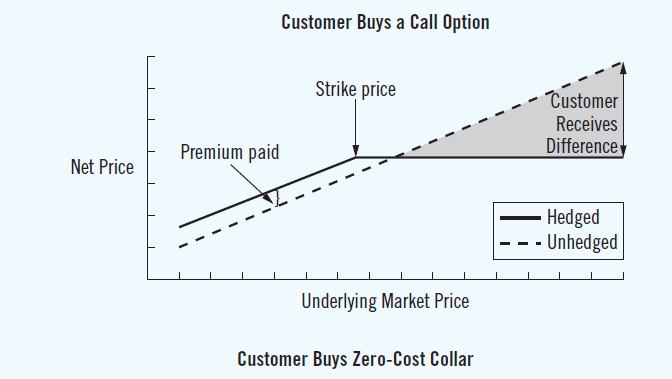
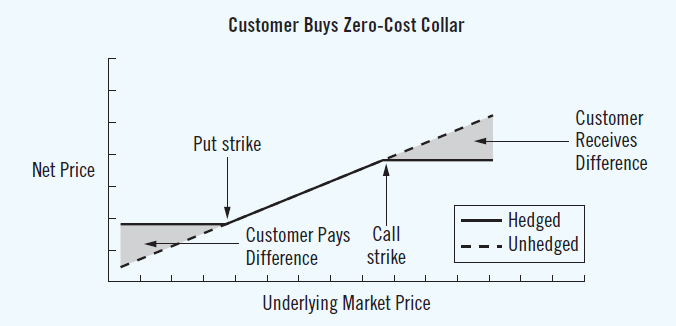
When a customer buys a fixed-price swap (figure above), they lock in a known price regardless of what happens to the market price. When a customer buys a call option (see figure above), they buy a “ceiling” beyond which their price will not rise. If the market price falls, they participate fully in that price drop. The difference between the price paid and the market price reflects the premium paid to have the “insurance” protection of the call option. If a customer is mainly interested in ensuring that the price paid falls within a price “band,” a zero-cost collar merits consideration (see figure below).

It should be noted that the use of “excess inventories” to physically hedge a future price exposure is often an option, though not the focus of this discussion. In the case of physical hedges, an analysis of the holding costs associated with the physical hedge must be consid- ered. In addition, there may be practical limitations to the extent of physical hedging possible. The market’s ability to allow you to acquire the desired amount of physical inventory in a short time span may severely limit the usefulness of a physical hedging program. Space limitations at the manufacturing plant may make it impractical to achieve a desired six- to twelve-month hedge for a critical material. Thus, financial hedges, which are not space-limited (but may be limited by your credit capacity), may be a more flexible way to proceed.
Source: Portions of these columns are excerpted with from Chapter 19 of the book Straight to the Bottom Line® (Rudzki, Smock, Katzorke, Stewart). “Straight to the Bottom Line” is a registered trademark of Greybeard Advisors LLC.
Market Skimming Model
In the market skimming model, prices are set to achieve a high profit on each unit by selling to supply managers who are willing to pay a higher price because of a lack of supply management sophistication or who are willing to pay for products or services of perceived higher value. An example of the application of this model is frequently seen by supply managers in the use of backdoor selling to non-supply management professionals in the firm. Supply managers should always seek to reduce the potential negative impact of this pricing model by cost, price, or value analysis to ensure that the higher price for the product or service is justified by the reported additional benefits.
Revenue Pricing Model
When downturns in market demand occur, suppliers often must resort to a current revenue pricing model. The emphasis of this model is on obtaining sufficient current revenue to pay for operating cost rather than on profit. Suppliers using this strategy are typically concerned about capacity utilization, covering fixed costs, and retaining skilled labor during market slowdowns, when they are willing to reduce their prices until market conditions change. However, supply managers should be on guard for negative impacts on quality and service resulting from cost cutting on the part of the supplier.
Promotional Pricing Model
The promotional pricing model presents pricing for individual products and services that is set to enhance the sales of the overall product line rather than to ensure the prof- itability of each product. Current examples of this are the sale of cell phones at below cost in order to induce consumers to buy the annual service contract, or the use of ex- tremely low prices for printers that require the use of the supplier’s highly profitable ink cartridges. Total cost of ownership (TCO) analysis (discussed later in the chapter) should be used to avoid surprising and unfavorable financial impacts that can result from deal- ings with suppliers using this model.
Competition Pricing Model
The competition pricing model focuses on pricing actions or reactions to pricing pro- posals offered or expected to be offered by the supplier’s competitors. The pricing strat- egy is based on determining the highest price that can be offered to the supply manager that will still be lower than the price offered by competitors. An excellent example of this model is the reverse auction process.
Cash Discounts
The practice in most industries is to offer incentives to pay invoices promptly. One way to encourage this is to offer cash discounts for payment within a certain period of time. For example, a seller may offer a discount of 2 percent for invoice payment within 10 days of receipt. The seller usually expects full payment within 30 days. (This is often expressed as “2 percent 10/net 30.”) Unlike quantity discounts, it is usually worthwhile to take advantage of cash dis- counts. Purchasers can rarely earn the equivalent return within a 10-day period of trans- actions offered with a cash discount. The opportunity cost of not taking the discount is almost always higher than the opportunity cost of taking the discount. Well-managed firms take advantage of cash discounts and arrange payment within the specified time frame.
Understanding the pricing model used by suppliers can provide supply managers with significant insights into the strategies needed to generate cost savings for their firm.
Using the Producer Price Index to Manage Price
As noted earlier, price analysis is appropriate for certain types of commodities. Specifically, monitoring price instead of cost is appropriate for market-based products where pricing is largely a function of supply and demand. Examples include steel, pa- per, plastic, and other types of bulk commodities. When assessing whether the price charged is fair compared with the market, managers can compare price changes for a purchase family to an external index. An important factor when conducting a price analysis is the Producer Price Index (PPI), which is maintained by the U.S. Bureau of Labor Statistics.
This information can easily be downloaded from the Bureau of Labor Statistics web page (www.bls.gov). The index tracks material price movements from quarter to quarter. It is scaled to a base year (1988) and tracks the percentage increase in material commodity prices based on a sample of industrial purchasers. By converting price increases paid from quarter to quarter into a percentage increase, and com- paring the changes to the PPI for a similar type of material, the purchaser can determine whether the price increases paid to the supplier of that material are reasonable. To use this tool, users will first need to identify the supplier’s standard industrial code (SIC). This can be found at www.FreeEDGAR.com. Next, look at the price index for the SIC and product that you are interested in. Consider the following example for iron cast- ings. The PPI for iron castings is shown in Exhibit 11.8.
Price paid to supplier on March 30, 2011: $52.50/unit
Price paid to supplier on June 30, 2011: $53.20/unit
Percentage price increase = ($53.20 − $52.50)/$52.50 = 1.33%
Steel castings PPI (March 30, 2011) = 127.2
Steel castings PPI (June 30, 2011) = 127.5
Percentage inflation for steel castings = (127.5 − 127.2)/127.2 = 0.2%
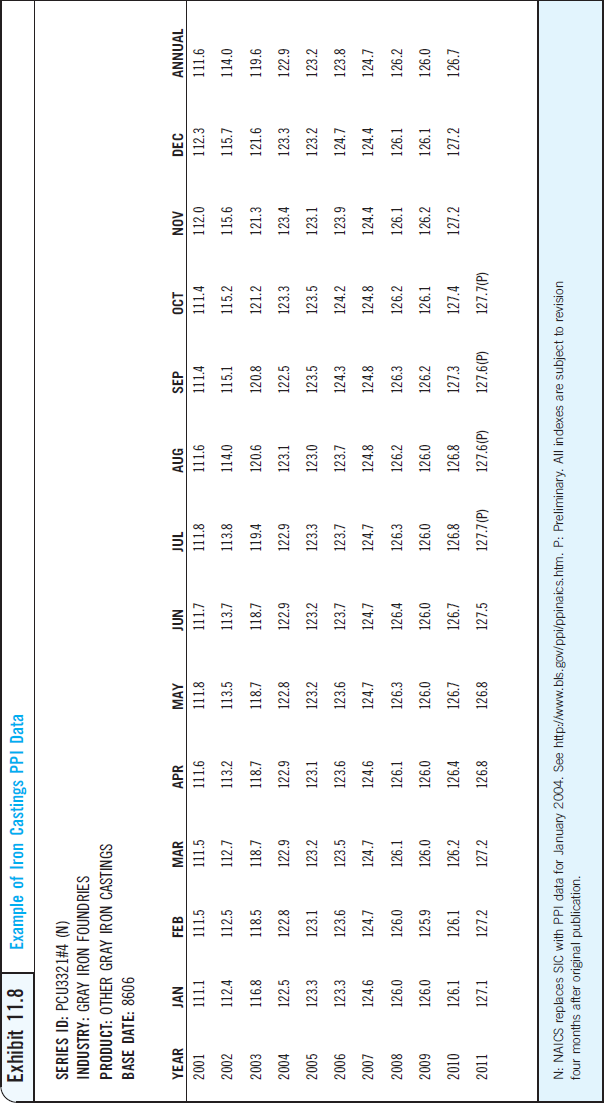
In this case, the price increase paid by the purchaser is over five times as much as the in- crease in the PPI for iron castings—surely an unreasonable increase. The purchaser should definitely question the supplier about this recent price increase, and negotiate a better price.
In addition to PPI data, the Bureau of Labor Statistics website also contains informa- tion on labor rates in different regions of the country, and updates on pricing and mar- ket conditions. Information on employment cost data is also available in Supply management magazine’s “Buying Strategy Forecast,” a semimonthly newsletter, and the Direct-ICE report prepared by Thinking Cap Solutions (www.ice-alert.com). Other sources of commodity price information are the “Pink Sheets” published by the World Bank (www.worldbank.org/prospects).
Some companies set an objective of consistently bettering price inflation with suppli- ers. That is, they expect that performance should be better than the market.

As shown in Exhibit 11.9, this can provide the company with a relative competitive advantage in terms of pricing. Caution should be used when applying PPI data that match the commodity being purchased. The buyer should carefully study the history of the index to ensure that it has a strong correlation with the price history of the commod- ity being purchased. Several questions should be asked in this situation:
• How did the supply management situation affect the price fairness and reason- ableness at the time?
• How have conditions (e.g., delivery requirements) changed?
• What is the effect on price of changes in the quantity of a material or service purchased?
• Was the supply management situation a sole source or competitive source?
• Are the index comparisons driving supply management strategies?
A real benefit of using this price analysis approach is to track price changes across different commodities and compare performance. For example, consider the following.
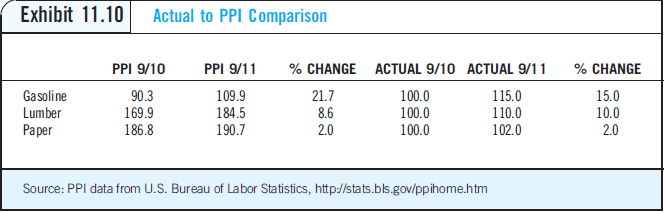
Three sourcing teams are discussing their cost results for the past year:
Gasoline team: 15 percent cost increase
Lumber team: 10 percent cost increase
Paper team: 2 percent increase.
Which team has been most effective at managing costs for the year?
At first glance, it would appear that the paper team is doing the best because they have the lowest cost increases (2 percent). However, in comparing the results with the PPI data shown in Exhibit 11.10, the picture is markedly different. The lumber team has failed to capture savings in a market that has seen prices increase by only 8.6 per- cent, while the paper team has limited price increases to 2 percent, which is only par for the course in terms of what is happening in the market. The gasoline team, however, has been able to contain price increases to 15 percent in the face of a market that has seen gas prices increase by more than 21 percent, largely due to speculation associated with the Iraq war during this period. This analysis can help identify different price changes in markets where a fair and open market is present.